Logs & Monitoring
Logs location
Logs are located under '/opt/ocspd/var/log' with the following distinction:
-
Application logs are spooled to 'ocspd.log';
-
Administration logs are spooled to 'ocspd-admin.log' and the log file can be signed upon rotation.
| These log files are rotated daily. |
Logs download from the Web Management Console
Step 1: Access the OCSPd Web Management Console;
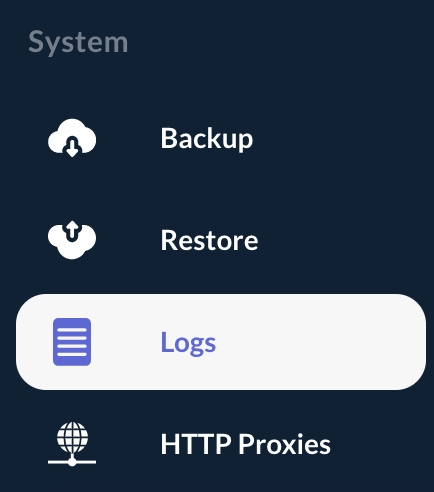
Step 2: In the 'System' left menu, select 'Logs':
Step 3: All the logs files under '/opt/ocspd/var/log' can be downloaded:
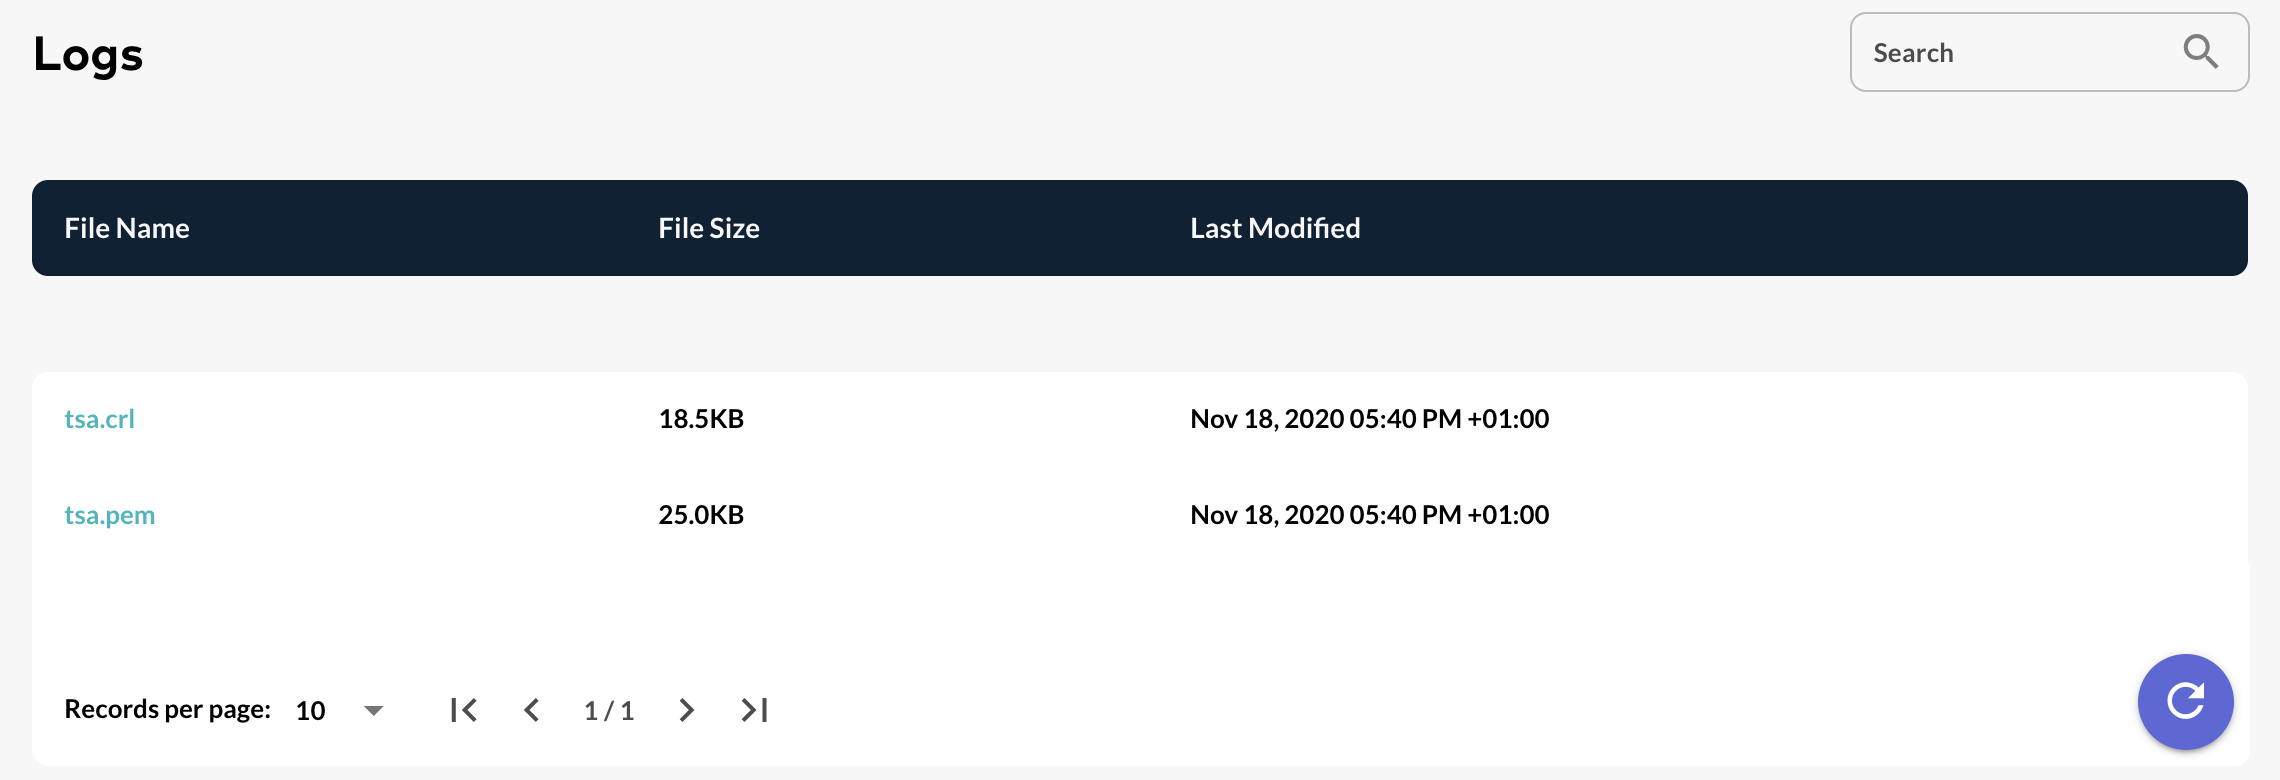
Step 3: All the logs files can be refreshed by hitting the 'Refresh' button:


Managing the OCSPd Log Level
|
3 Log Levels are available within OCSPd:
|
Step 1: Access the server through SSH with an account with administrative privileges;
Step 2: Load the OCSPd Configuration Utility with the following command:
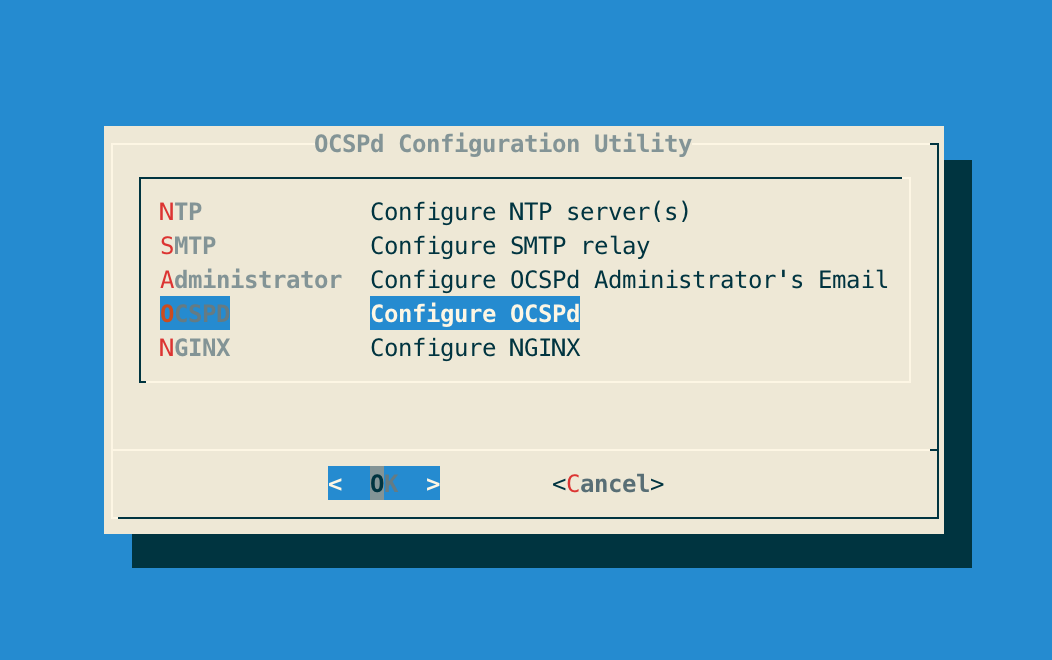
# /opt/ocspd/sbin/ocspd-configStep 3: In the main menu, select 'OCSPd':
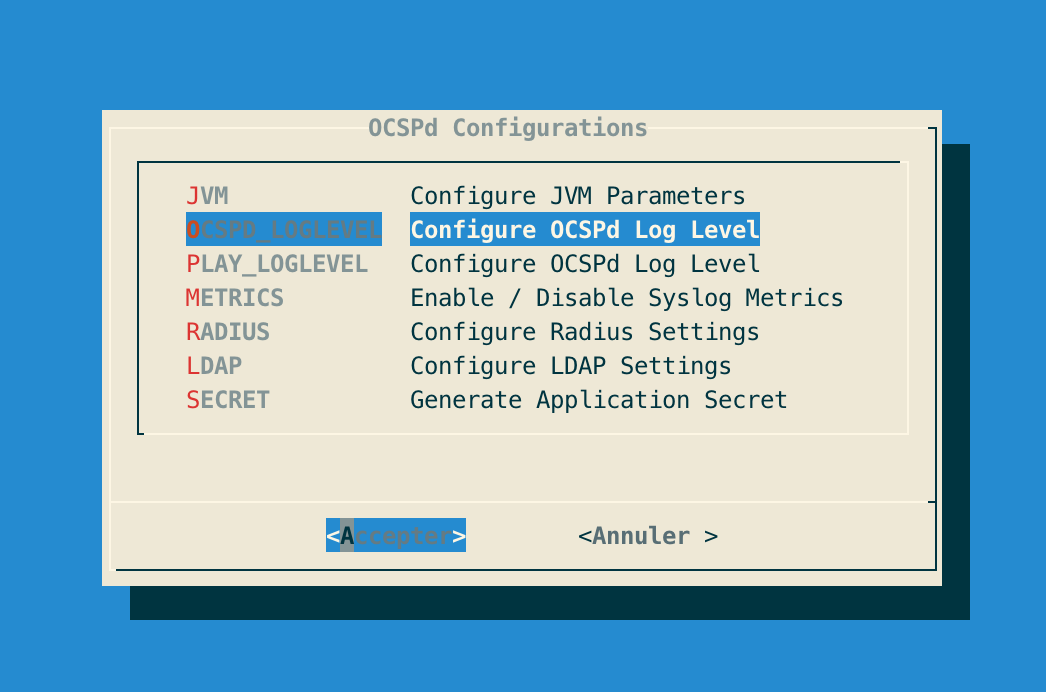
Step 4: In the OCSPD menu, select 'OCSP_LOGLEVEL':
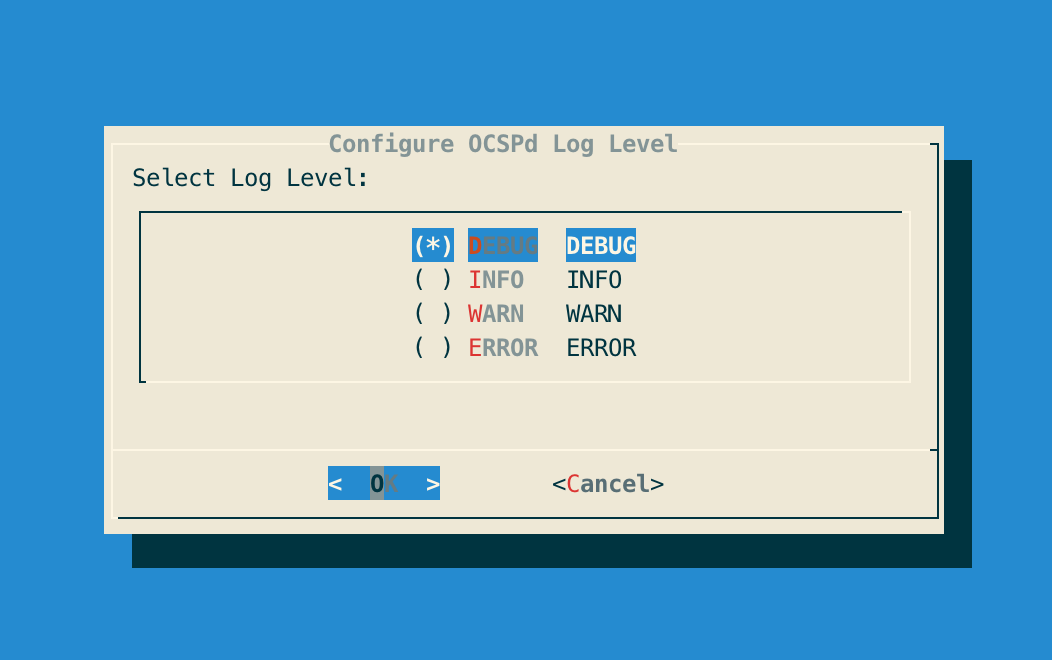
Step 5: Select the Log Level and validate:
Step 6: The OCSPd configuration is updated:
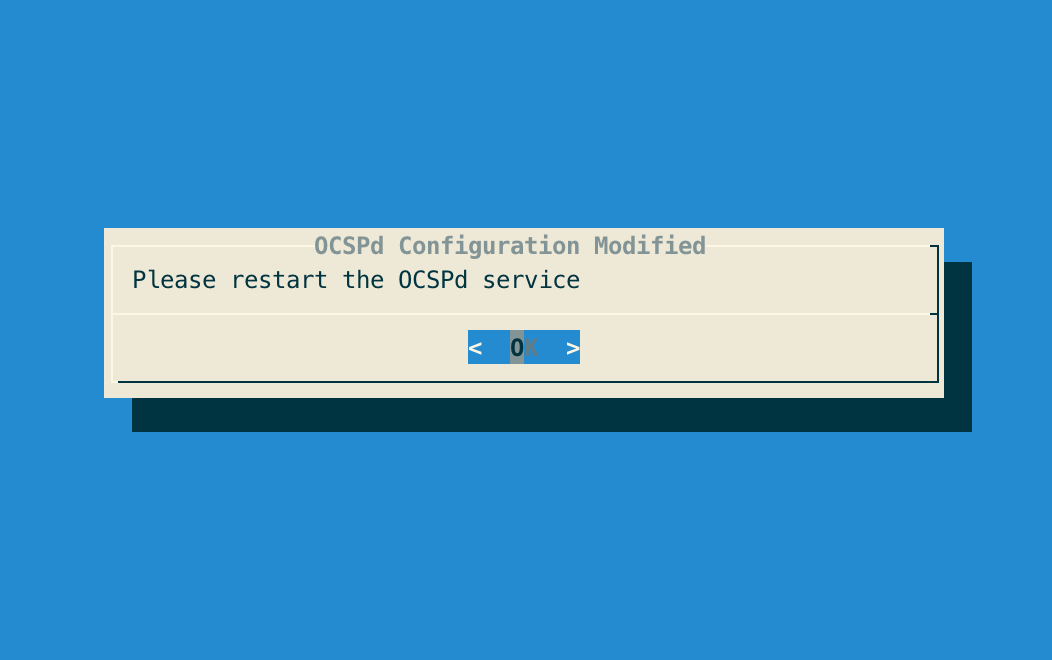
Step 7: Exit the OCSPd Configuration Utility and restart the OCSPd service with the following command:
# /etc/init.d/ocspd restart